
Conversion Funnel Optimization
Conversion Funnel Optimization
Using Funnel Visualization Reports To Find & Fix Conversion Problems
There is a multitude of reasons why users may not complete their journey through the funnel. Why they don’t fill out the lead form, or they abandon the cart is often guesswork - enter Google Analytics.
Google Analytics has a Funnel Visualization report that can help identify troubled areas, and pages where users exit their journey to conversion.
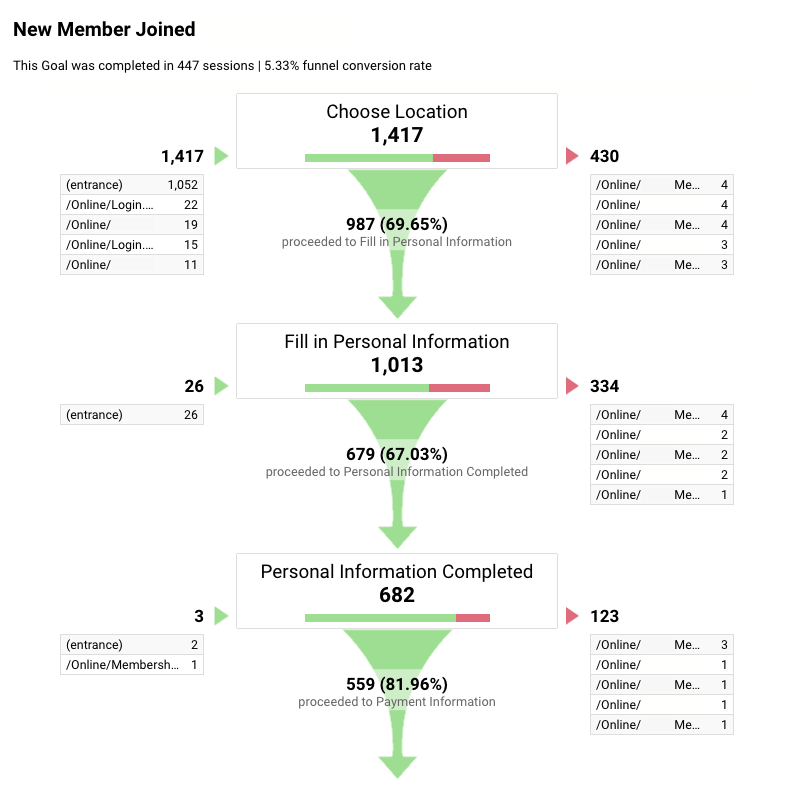
Funnel visualization report with the major steps highlighted
Setting up the Funnel Visualization Report
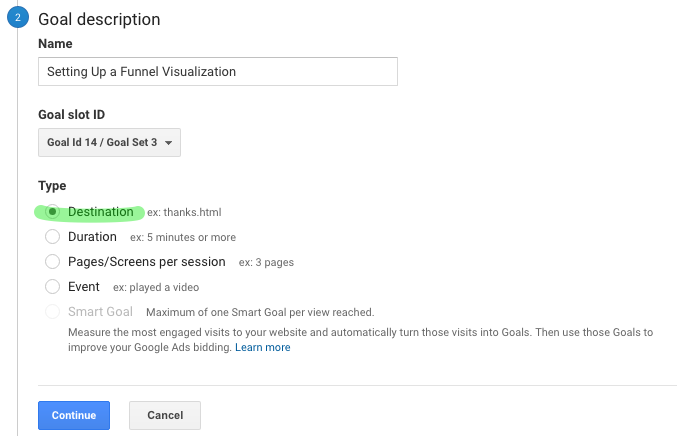
The goal type has to be Destination in order to use the funnel visualization report
The next step is setting up the pages users will visit, or that you expect they will, on their way to the goal page.
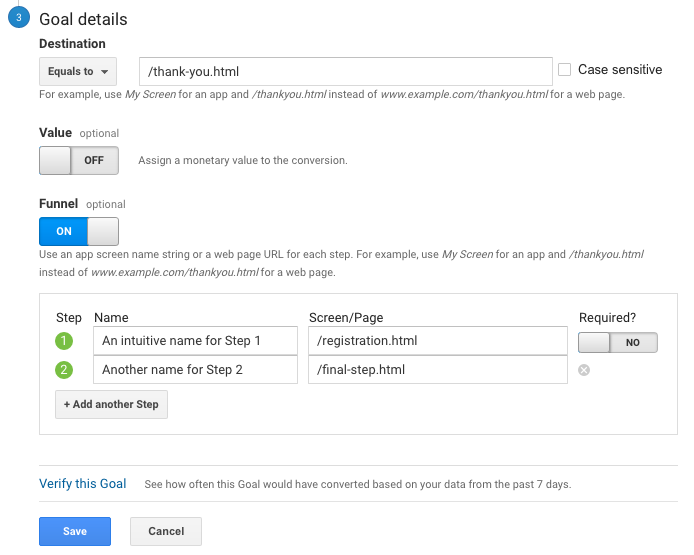
Name each step intuitively so they make sense to anyone viewing the report
In this step you’ll need to specify each page in the same sequence the users will step through them. In a simplified version, this could look something like this for example,
-
/thank-you.html is the destination URL that signifies a goal has been completed
-
Users will start their journey at the landing page /registration.html — this might be the page users are sent to when they click on a paid ad, i.e. within an online banner
-
Next, the users will go to the /final-step.html — this page might have the contact form on it to gather lead details
-
When users click on the submit button they are redirected to the thank you page — the goal is recorded as completed
Using the Funnel Visualization Report

The report shows you where users exit the funnel
The funnel report will show you if there are pages within the steps that have a high drop off rate. This can give you an indication about what pages, or steps you should be paying attention to. For example, in the funnel report shown above 871 users leave the cart to go to the sign in page. Those users may or may not return to complete the goal.
By optimizing the user experience so that it isn't necessary to leave the funnel to sign in, those 871 prospective customers would likely continue on the journey with the 3,200 others, and a portion of those would likely go on to become customers.
If you were running a local donation campaign, and a large number of people dropped off from the landing page, you’d want to look at optimizing that page. In other scenarios, you might have forms that users have to fill out. If you have a large drop off at a certain step, it could identify a barrier, such as too many unnecessary form fields that are a required for users to complete. This can often be questions like, “How did you hear about us?”, “How many employees work at your company?”, etc.
3 Tips for Lowering Drop-off Rates
-
Provide all relevant, pertinent information and details about timing, schedules, price, shipping, etc. Eliminate unpleasant surprises in further steps.
-
If a shopping cart or multiple steps are involved in the process, consider offering an incentive, or discount to strengthen user interest.
-
Offer discount codes or other benefits in exchange for a user’s email address. This gives you a possible conduit to contact people who abandoned the process. You can then re-engage them through other remarketing efforts.
Rarely do users arrive at your site and complete the desired action you want them to in a single step. Generally, there are a number of steps or pages that users will visit before the goal is completed. A funnel visualization report can help you to identify areas in the user experience that need optimization.
If you would like to speak to one of the ImageX team who can walk you through these steps in more detail, just contact us or email info@imagexmedia.com.