Start UX with Analytics Data
Knowing who your users are is critical to every digital experience project. Knowing where users are coming from, what users are doing on your site, and how engaged (bounce rate, time on site, number of pages visited, etc.) can help you make better informed decisions. User research consists of a wide range of research tools, techniques, inputs and resources. The foundation of all of them is to gather useful information about users. When you know what users are trying to achieve, you can design and develop to help them achieve it.
How an Analytics-first Approach Works
In this article you’ll get an introduction to using Google analytics data to support and inform user research. Starting with data will serve to build a stronger understanding of how users are engaging with your digital experience.
There are different approaches to user research, and methods will vary depending on the project. With the analytics-first approach you can use data from Google Analytics as the starting point for the research process. Google Analytics data can be used at the start of your process to get a general idea of the types of users visiting your digital experience, and how they are using it. This data can then be used to create detailed user personas, and to analyze their behavior. The analytics data will tell you what visitors are doing on your app or website, but it can also be used to find out information about them as
people — which is what users are.
“Supposing is good, but finding out is better.” — Mark Twain
Reviewing your Google Analytics data is the optimal starting point of finding out more about your users.
Getting Started
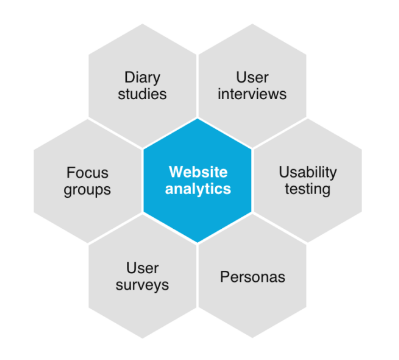
Here are some Google Analytics reports that are a really useful starting point for the user research process.
Important: Don’t use analytics data in isolation to make UX decisions. Your Google Analytics data is a starting point — a jumping off point for additional user research. Different approaches to user research can take the form of user interviews, user surveys, usability testing, and so on — analytics data is a great starting point.
Language and Location Data
Language and Location reports can be found under the
Geo sub-section of the
Audience reports. The geographical location of your users may alert you to any cultural factors that you should be aware of when designing.
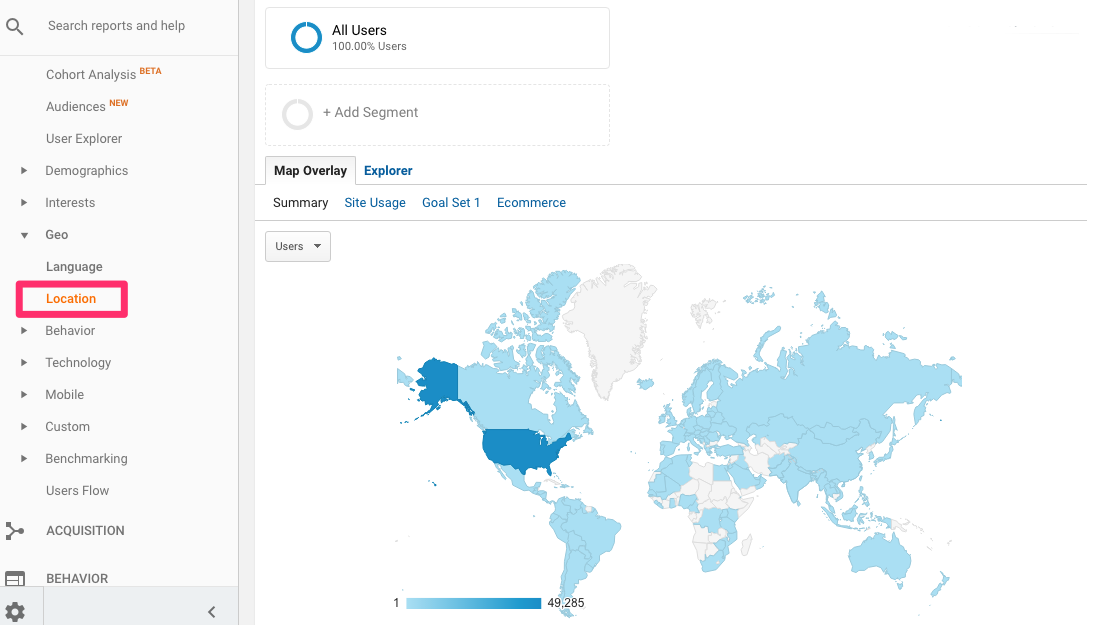
Understanding where users are might be able to inform you in regards colour, and the type of wording you might use for things like user help tips, or error messages. Visual design is also impacted by the language of your users. For example, the length of words will change when translated, and maybe you’ll end up with strange-looking calls-to-action in certain languages. Different alphabets will also have an impact. Factors like these will have an impact on your design, layout and copywriting.
Demographics Data
Demographics data is also under the
Audience section in Google Analytics. Remember, it’s important not to use analytics data in isolation. This is highlighted with this report. The data will tell you, with an 80%–90% degree of accuracy, the ages and genders of your users.
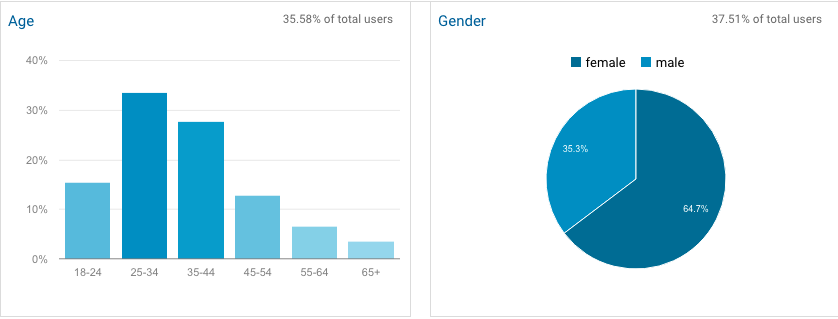
It’s important to look at the differences in user behavior. This is very true for different ages and genders.
Experiment and review your own analytics. Look at the differences between ages, and genders. Look at site usage metrics, visits, time on site, etc. Be sure to check out the conversion rates between groups. Demographics data is wonderful for figuring out who to recruit as usability testers. For example, if you notice that 75% of users are female, then you’ll want to ensure that women make up the majority of your usability testing group.
Browsers and Devices Data
These reports are found in the
Audience section too. They are really useful for functionality testing. You should look at which browsers site visitors are using, and then implement testing on the most commonly used ones. These reports also reveal hidden secrets about users. For example, you’ll want to carefully consider how device usage differs. This will impact on your approach to design for a multi-device world.
Benchmarking Data
You might have picked up on a theme here — much of the data you’ll be looking for in Google Analytics is in the
Audience section. This is where you’ll find Benchmarking reports.
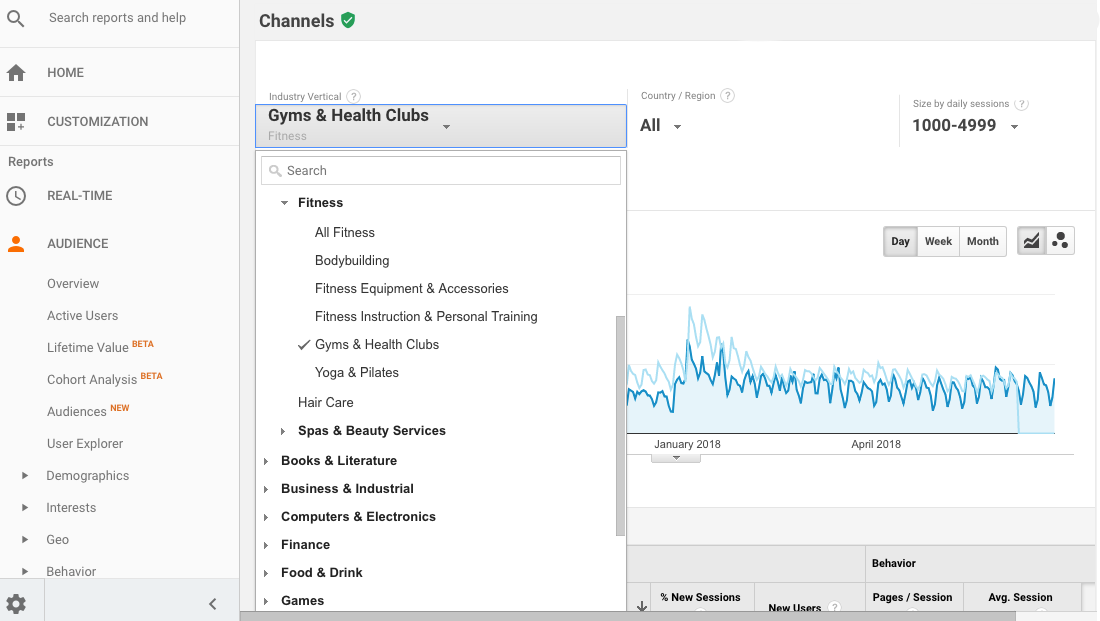
This data aims to compare your digital experience to those in a similar industry vertical. While not the most useful data, these reports still have value.
How to Use Benchmarking Reports 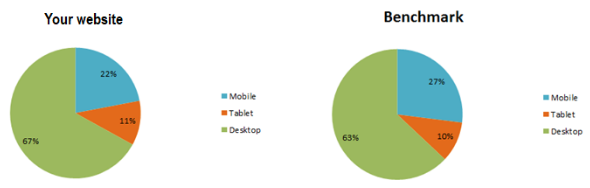
Use this data to compare device-type breakdown. Review the breakdown of mobile, tablet and desktop for a site compared to similar site can give you an idea of the type of users others are attracting. You can quickly see if your users are less likely to be on mobile than others in your industry vertical.
Note: you need to undertake additional research — this data just highlights if there’s a need to explore this further.
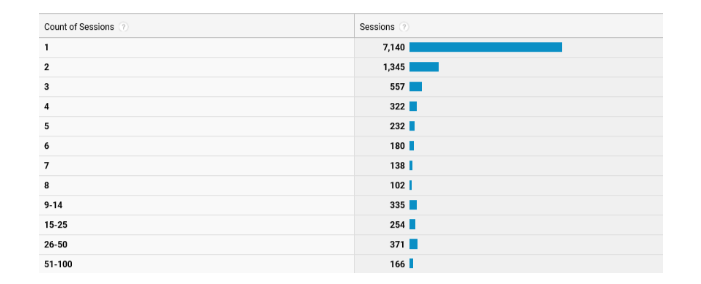
Frequency and Recency Data
Frequency and Recency data can be found in the
Behavior section of the Audience reports. This data will tell you the difference in behavior between New and Returning visitors, as well as show how frequently they visit. Frequency and Recency data can offer insights into user behavior. For example, if users visit several times on the same day, it could be they’re evaluating your services before making a decision to engage your brand. You can use this data to compare the user journeys of first-time visitors with those visitor coming more routinely.
Traffic Source Data
This is one of the most useful reports and one that marketers use regularly. Channel data is found in the
Acquisition section of Google Analytics. This data is also very useful for your initial research. The channel that visitors come in from can potentially tell you something about their intent. If visits happen through Paid Search, that means they likely used a keyword to start their search. The keywords that visitor use can tell something about what they were looking for. Knowing what users are looking — better understanding their intention — helps to prioritize certain content, and design a user journey that’s geared towards helping them achieve their intended goal.
Wrapping Up
Data about how users are
using your digital experience lays a foundation for an analytics-first approach to UX design. Don’t forget that it must be incorporated as part of your overall user research process.
How Google Analytics Data Can Inform User Research
- Inform usability testing and user interviews. The device, country and demographic data will help you choose what device to test on, and who to test.
- Persona creation and analysis. Use the data to give you indications about who your users are. Feed this information into the research used to create personas.
- Convincing stakeholders. Use Google Analytics data to back up arguments when stakeholders are more interested in quantitative data over qualitative data.
Here’s another great article on
using data and testing to improve the ROI of your web design.